COVID-19 in Graphics II - COVID-19 Clinical Trial
General Information | COVID-19

COVID-19 in Graphics II

Explore
    Add a header to begin generating the table of contents

    Knoema

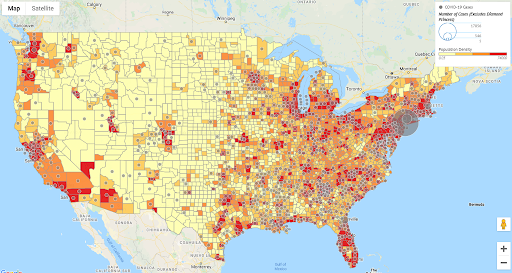
    An interesting view showing the number of confirmed cases of COVID-19 compared against that county’s population density. Not surprisingly those counties with a higher population density are seeing more confirmed cases than those with less density. There is one notable exception, Las Vegas, NV.


    Our Word in Data

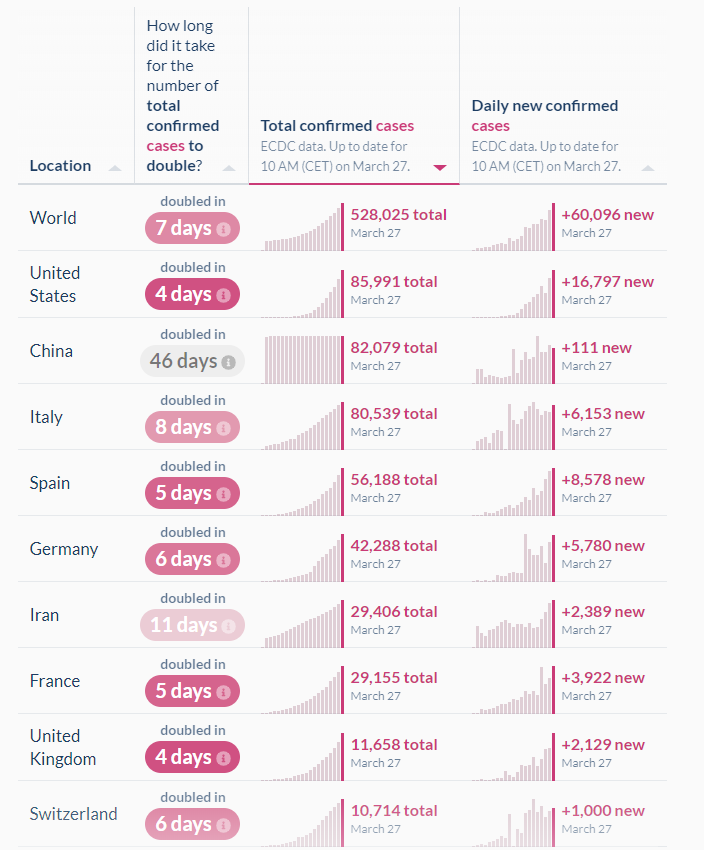
    This chart shows a view into the rate of infection, showing how long it has taken for confirmed cases of the virus to double. Views like this show the relative trend and can show how successful a country has been in “flattening the curve”.
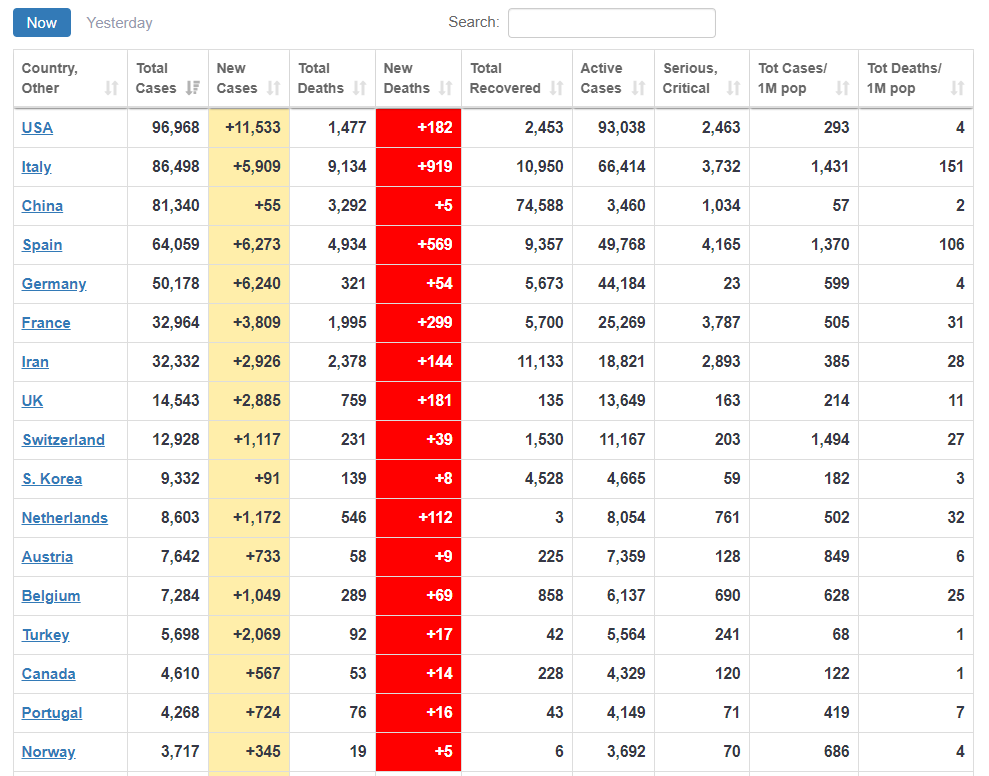

    Worldometers


    Sources

    Share this:
    Facebook
    Twitter
    LinkedIn
    Reddit
    Email

    Your choice regarding cookies on this site

    We use cookies to optimize site functionality and give you the best experience. Necessary cookies enable core functionality. The website cannot function properly without these cookies and can only be disabled by changing your browser preferences.

    For more detailed information on the cookies we use, please check our Privacy Policy.

    By continuing to access this website you are giving us consent to collect cookies.

    Want to stay informed?

    With an ever-changing situation like COVID-19, it’s important to stay as tuned in as possible. Submit your information below so we can send you periodic updates.